fbpx

🔥  First Time? Get 10% off with the coupon “NEWHERE”

Excel Templates and Dashboards

Excel templates and dashboards

Adnia wants to transform the way you handle data from your business, or personal project, using something as simple as an Excel spreadsheet. We use the essence of Business Intelligence to make you optimize your management, simplifying data analysis and improving business processes through solutions with great visual impact. Below is a sample of what […]
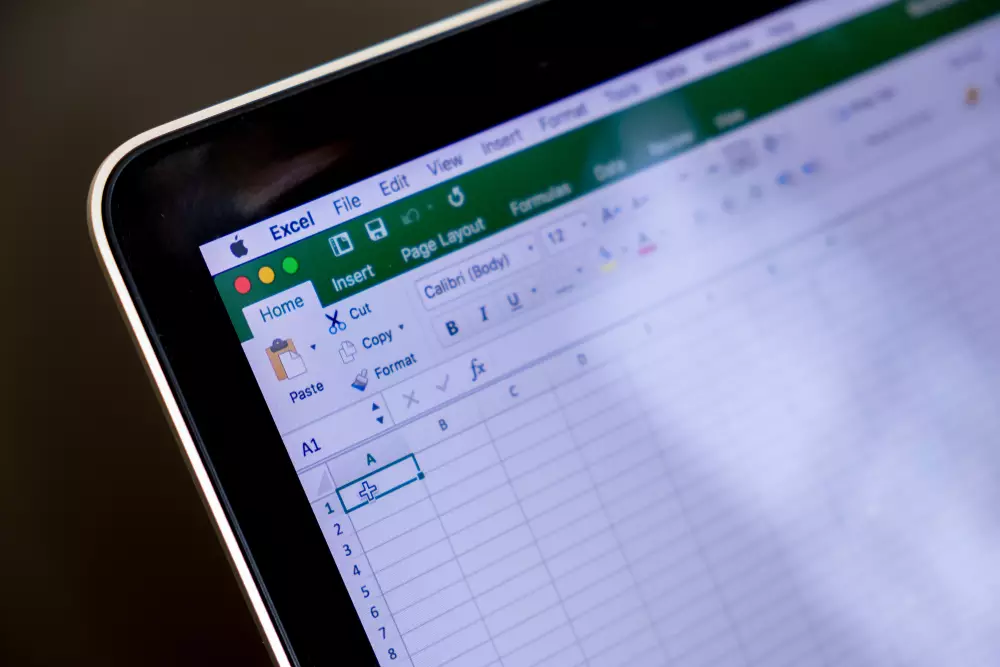
how-to-use-excel-shortcuts

Learn how to use Excel shortcuts and optimize your time.

Optimize your time and learn how to use 15 Excel shortcuts to gain more agility when working with your spreadsheets. Excel has a huge amount of tools and functions for you to assemble your spreadsheets. And with so many functions, there are still Excel shortcuts to optimize your time. That’s because in Excel, you have […]

Excel Templates and Dashboards

6 things that can help a lot, your reports in Excel

It doesn’t matter if you are moving towards a future career as a data analyst, you want a new skill to improve your job or you want to transform your budget. Knowing how to use Excel definitely makes your life and your business easier. It can be an incredibly powerful tool for searching information and […]

Excel Templates and Dashboards

Find out what VLOOKUP is and how it can optimize your search in an Excel spreadsheet

Excel spreadsheets are known to have a wide range of formulas and functions. Each function is designed to perform calculations using specific values ​​in a given order. Something that sometimes intrigues users is the VLOOKUP. Several people who use Excel have heard of the VLOOKUP function, but do not understand how it works or even […]

Excel Templates and Dashboards

10 Hacks to make your life easier in Excel

Excel is a very popular spreadsheet program, developed by Microsoft, supported by all modern operating systems: macOS, Android, Windows and iOS. In addition, it has a wide variety of features: pivot tables, calculations, graphical tools and Visual Basic – a programming language incorporated in some Microsoft applications. Microsoft creates updates for this program regularly, which […]

Creating Actual vs Target Chart in Excel

Creating Actual vs Target Chart in Excel – Tutorial Video

Actual-versus-target charts are Excel charts which demonstrate the comparison between actual and target performance. Best uses for actual-versus-target charts would be a comparison among a group and how each performed versus his/her target, or comparison of time periods for performance. So, something like department budget achievement month-over-month. [embedvideo type=”youtube” id=”rPRAVk4gDGM”] [gap height=”35″]

Excel Templates and Dashboards

How to use Conditional Formatting Icon Sets in Excel – Tutorial Video

Conditional formatting icons are a visualization tool you can use to quickly and easily bring attention to comparisons using icons provided within Excel. In this video tutorial, you’ll learn how to use this great Excel feature. [embedvideo type=”youtube” id=”KhJLD4s8N6k”] [gap height=”35″]

Create Sparkline in Excel

How to create Sparklines in Excel – Tutorial Video

In this video tutorial, you’ll learn how to create awesome sparklines using Microsoft Excel. We hope you enjoy this tutorial, and feel free to download the sample file used in this video training at the end of the post. [embedvideo type=”youtube” id=”Y93KIw0n3e4″] [gap height=”35″]

Recognized Worldwide

approved templates worldwide

Practicality and Agility

easy-to-use templates

Humanized support

real people to serve you

100% Secure Checkout

hight security of paypal and stripe